

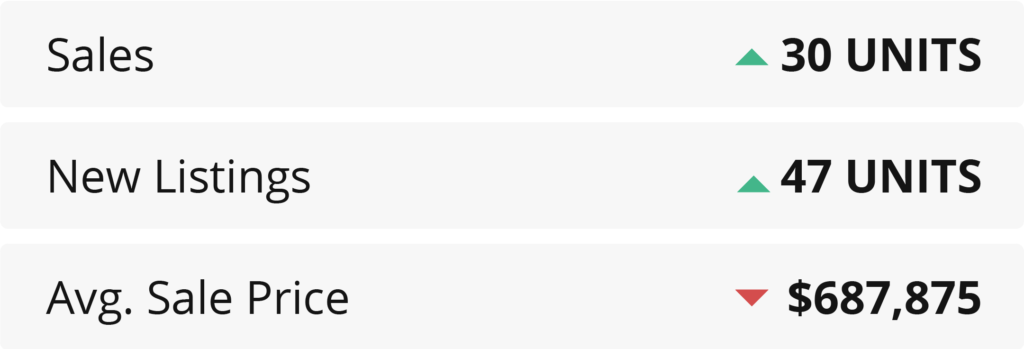
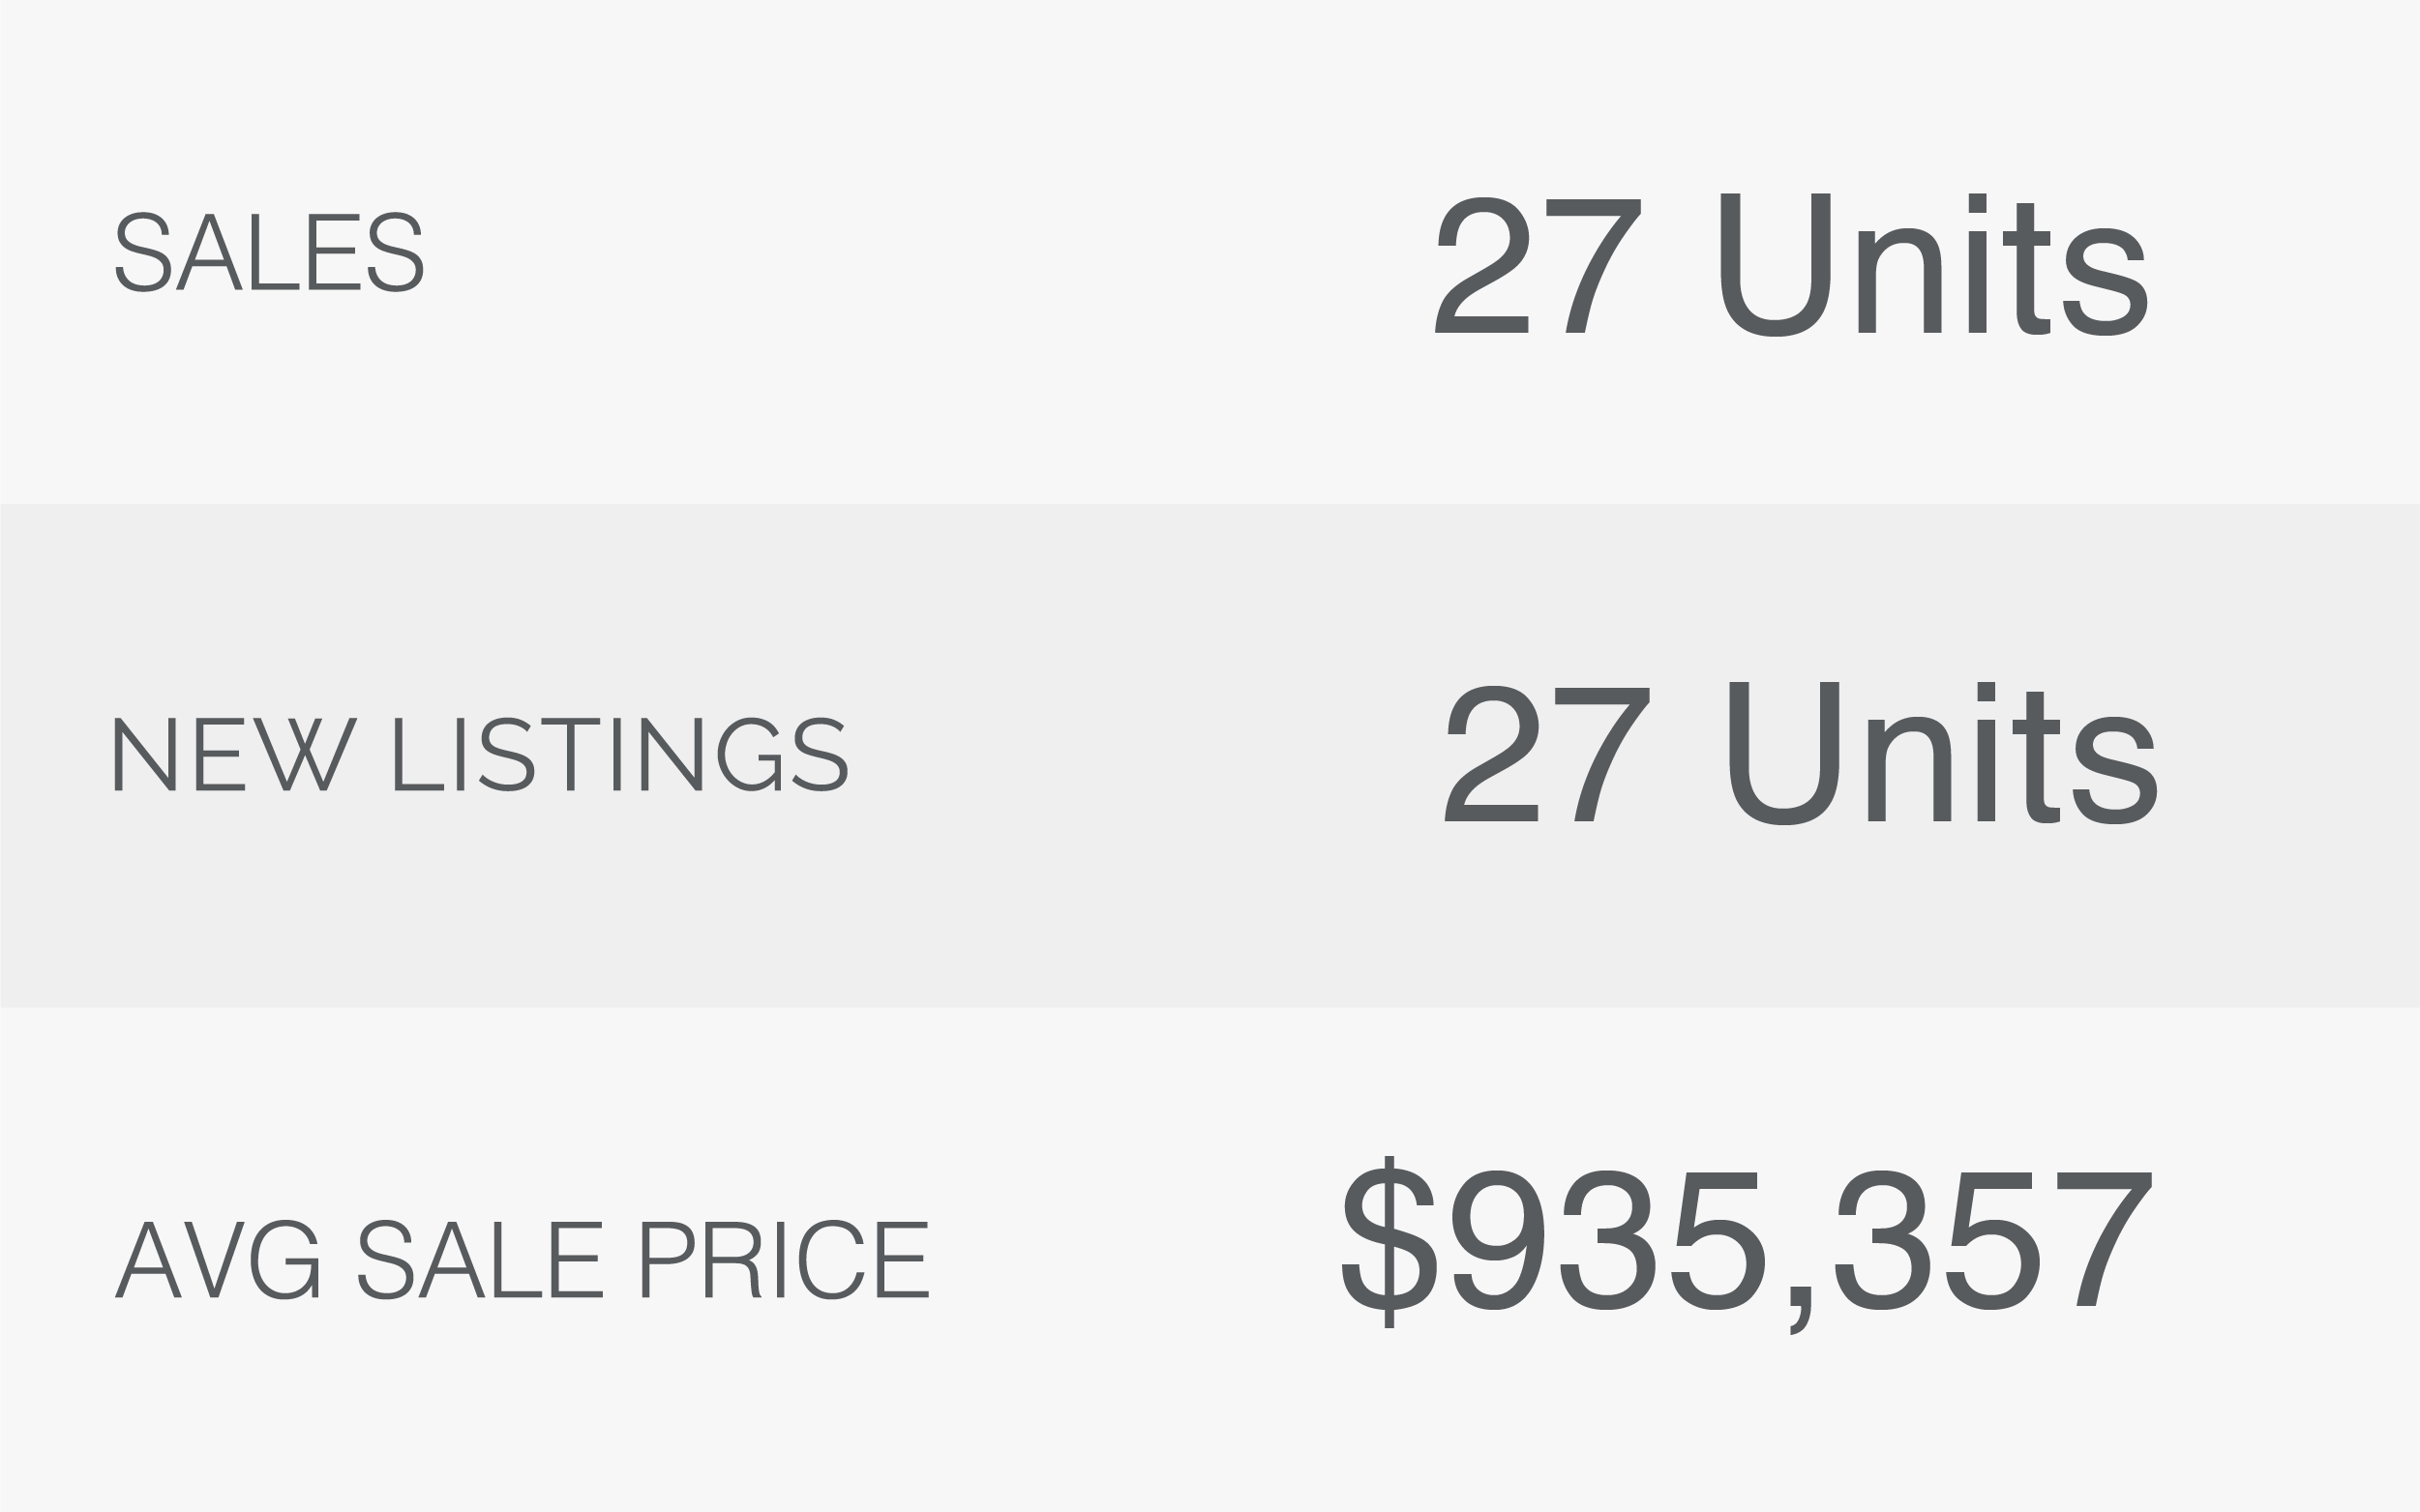
Once again in February, the market continued to pick up a little over the previous month, and was also slightly stronger than total sales volume for the month of February 2018. There were 30 total sales transactions in Canmore in February 2019.
The majority of the sales activity transpired below $650,000, with zero sales between $651,000 and $829,000, and only 4 sales over $650,000 and under $1,000,000. There were 5 transactions over $1,000,000 with the highest priced sale in February 2019 at $1,475,000 which was a near-new town home property in Spring Creek.
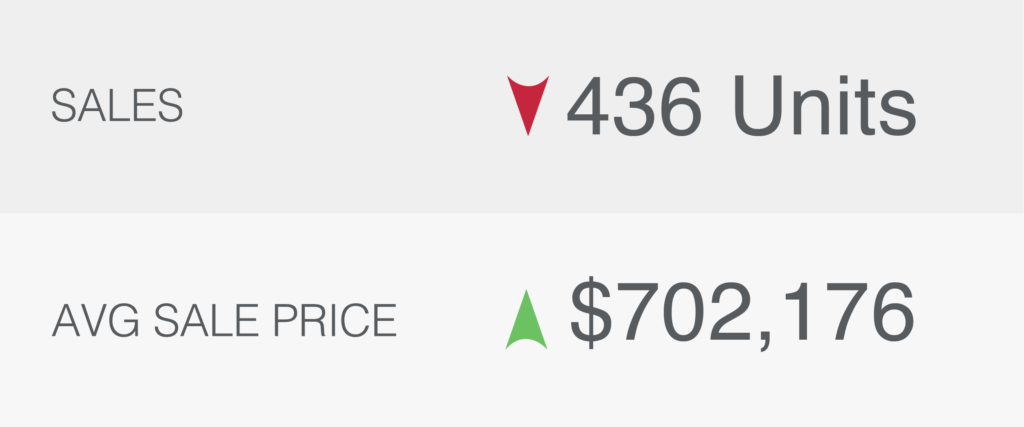
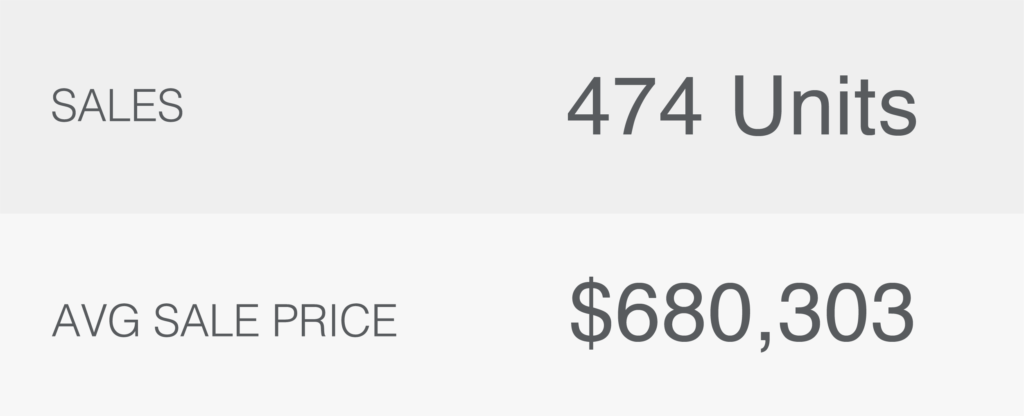
The average sale price for February 2019 was $687,875. This is down from February 2018’s average sale price which was $793,848. In 2018 however, there were 9 sales over $1,000,000, as compared to the 5 in 2019. This combined with some higher priced sales over the $1,000,000 mark, resulted in pushing the average sale price for the month of February 2018 considerably higher than this year.
There were 47 new listings that came to market in Canmore in February. Our active listing inventory continues to be low with only 173 properties for sale, including 11 hotel condos.
 Sales over $1M: 5
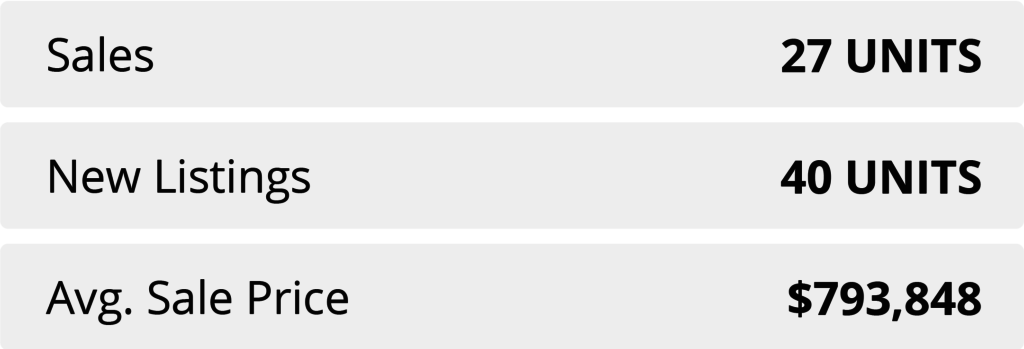 Sales Over $1M: 9


 Sales over $2M – 2
 Sales over $2M – 0